



Freight Market Intelligence
Live Shipping Rates, Port Data & Analytics Tools for E-Commerce Importers
DataFreight brings together five logistics tools for import planning: port congestion, container shipping rates, container tracking, freight rate benchmarks, US import volumes. Check the reporting period, methodology and limitations on each tool before using its figures.
All tools combine open market data with proprietary auction pricing unavailable through traditional freight platforms.
Analytical tools for logistics
US Port Congestion Tracker
Real-time utilization and capacity for 12 major US container ports
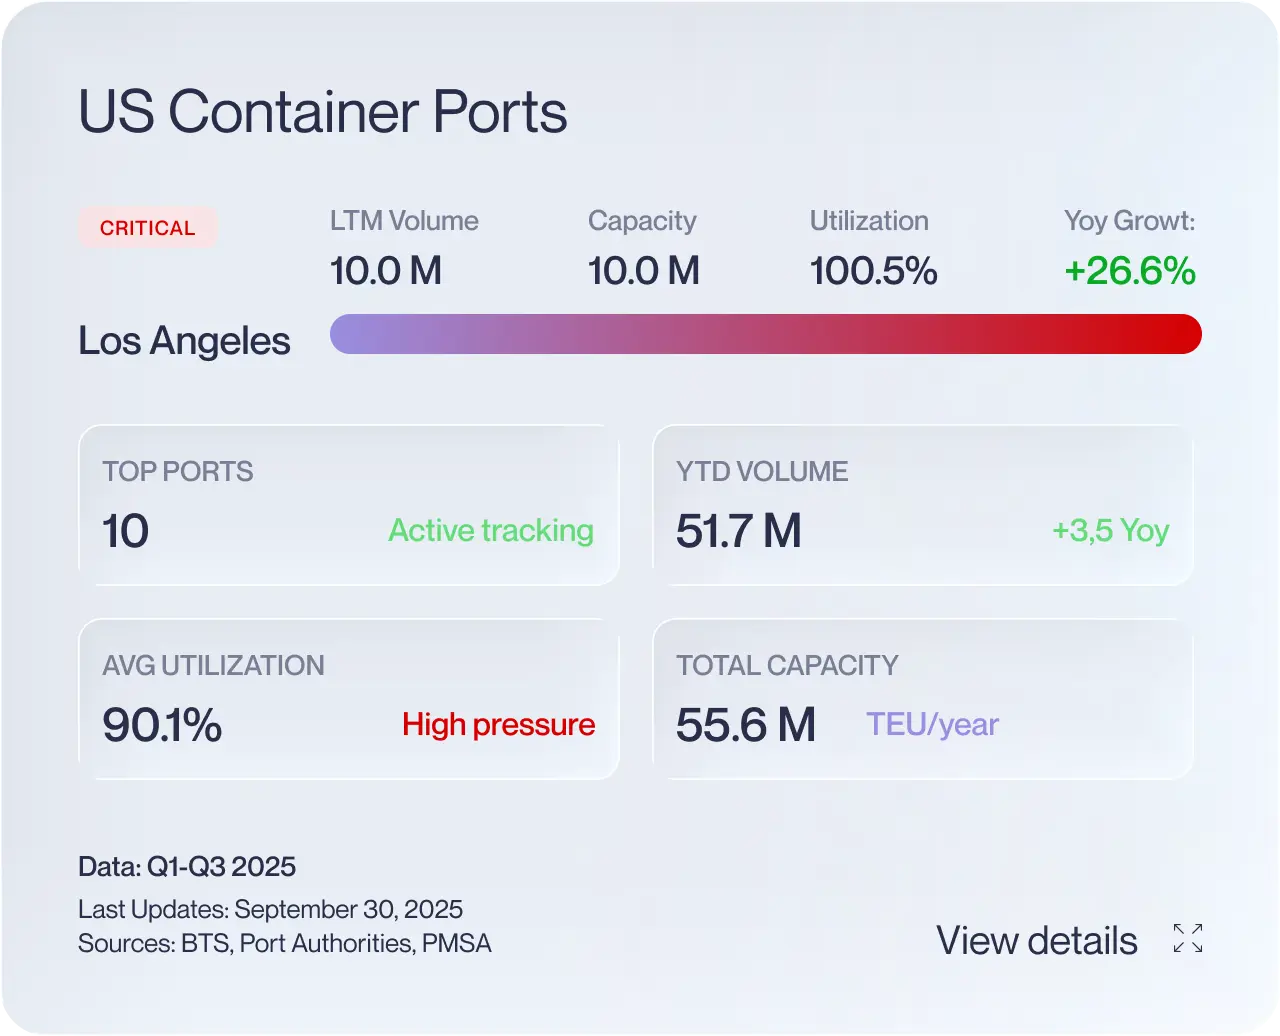
Track live container volume, capacity utilization, and year-over-year growth across the 12 largest US container ports. Congestion above 80% utilization typically adds 7-14 days to transit time and 15-25% to total shipping costs through demurrage and detention charges.
Container Shipping Rates
AiDeliv Market Rate Index: Asia-US freight pricing trends
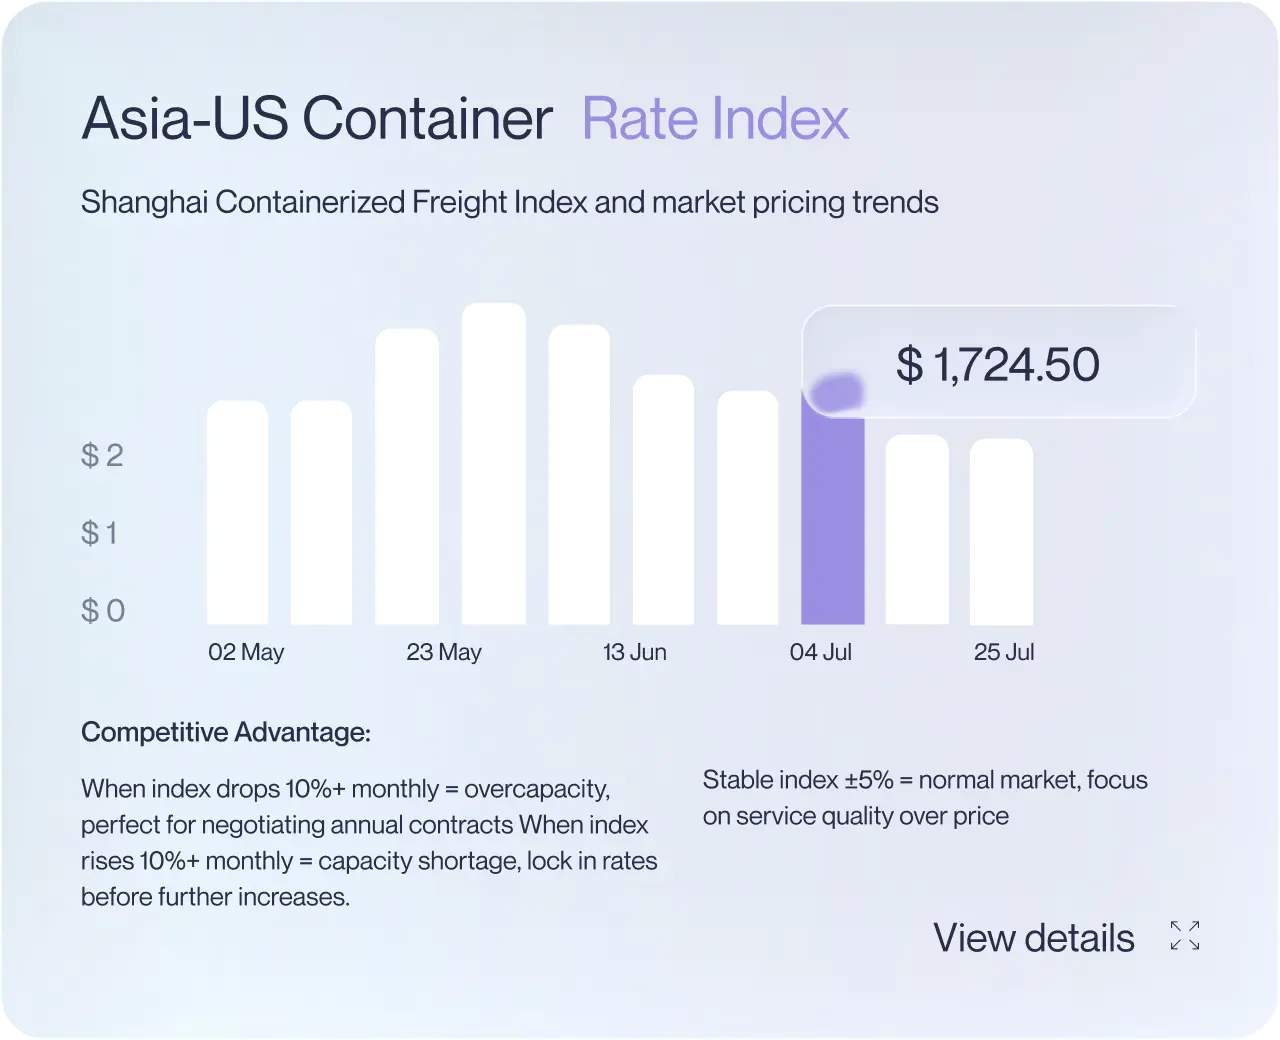
The AiDeliv Market Rate Index tracks weekly Asia-US container rates using open market data and winning bids from 4468 completed reverse freight auctions on the platform. Current composite: $1,724.50. Auction-based rates run 15-40% below static forwarder quotes because carriers compete in real-time for aggregated shipper demand.
Container Tracking
Real-time vessel positions and container locations worldwide
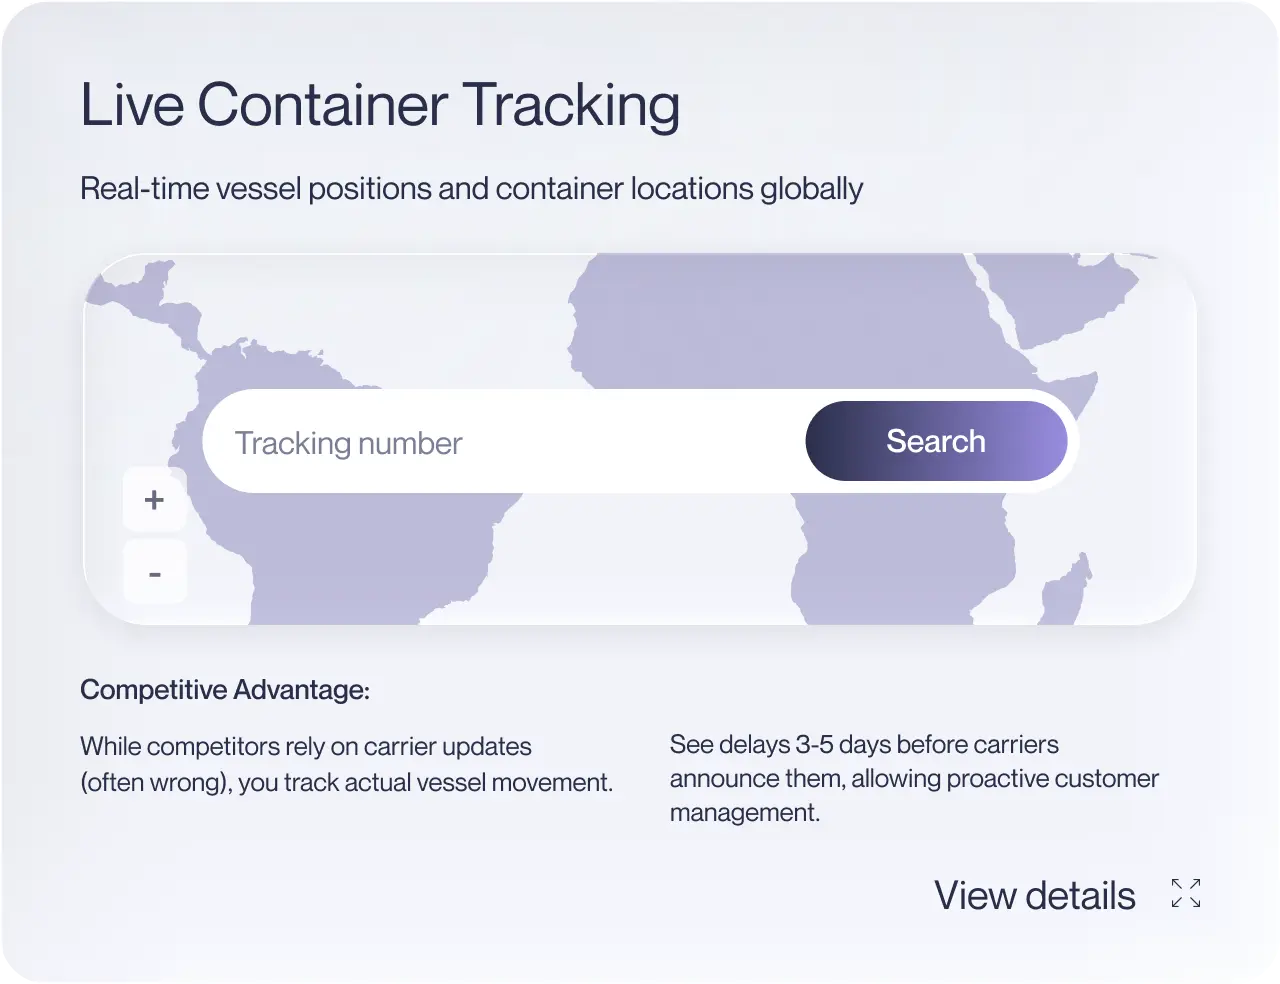
Track any ocean container or vessel using AIS transponder data. Enter a container number or Bill of Lading to see real-time position, speed, ETA, and route. For shipments booked through AiDeliv auctions, tracking includes automated carrier milestone alerts at every stage.
Freight Rate Calculator
Estimate ocean and air freight costs for any Asia-to-USA route
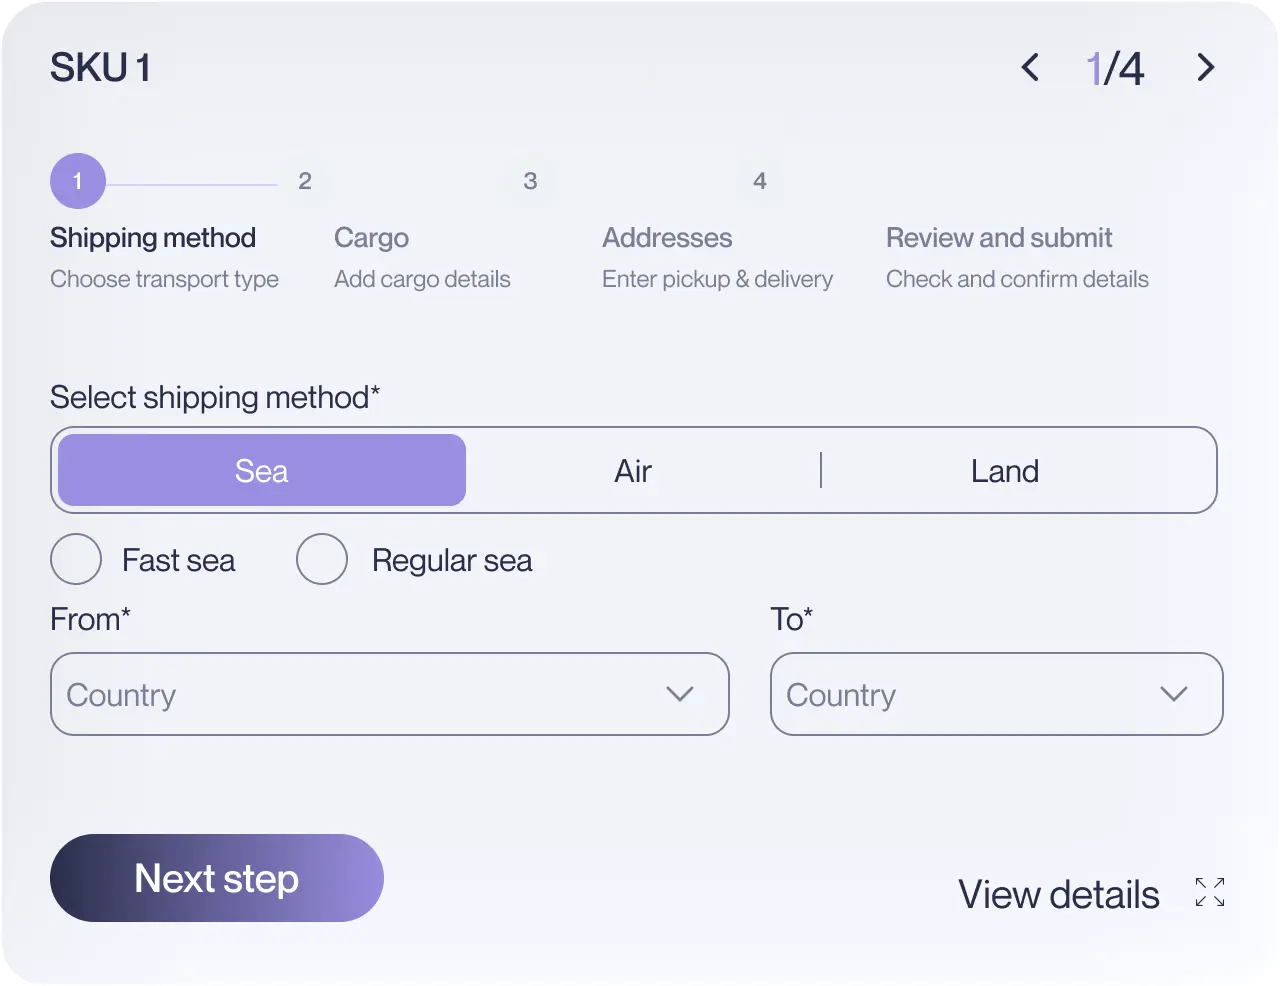
Get instant freight cost estimates based on real auction data from 4468 completed shipments on AiDeliv. Compare ocean freight (12-38 days) and air freight (5-8 days) for any route between major Asian origins and US destinations.
US Import Data by Category
Monthly import volumes from US Census International Trade data
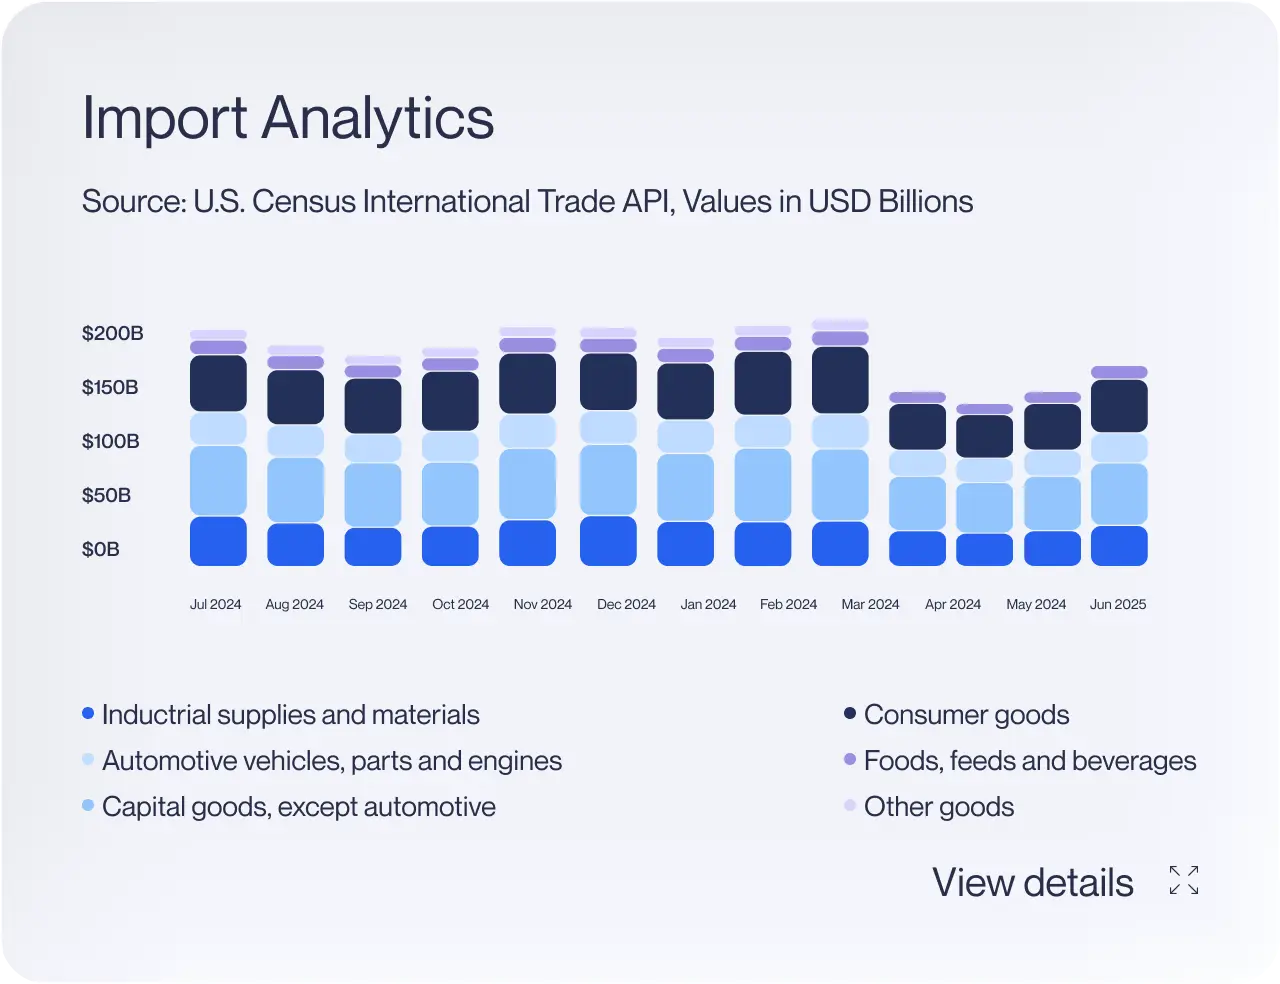
Track monthly US import volumes by product category to identify market trends, spot oversaturated categories, and time purchasing decisions. Live data from US Census Bureau International Trade API, broken down by product category and country of origin.
How Freight Market Data Helps E-Commerce Importers
Use import volumes to compare demand trends, port data to review congestion, and rate information to frame a freight budget. These tools answer different questions. For a shipment-specific offer, see how carrier bidding works.
All tools combine open market data with proprietary auction pricing unavailable through traditional freight platforms.
Ready to Ship? Run a Freight Auction
Put this market data to work. Post your shipment and let carriers compete for your cargo in a reverse auction. First bids arrive within 3-12 hours. DDP all-in pricing, $100,000 carrier liability coverage per shipment.
